Overview:
MARS transforms application delivery data flows into actionable intelligence that enhances application availability, security and performance.
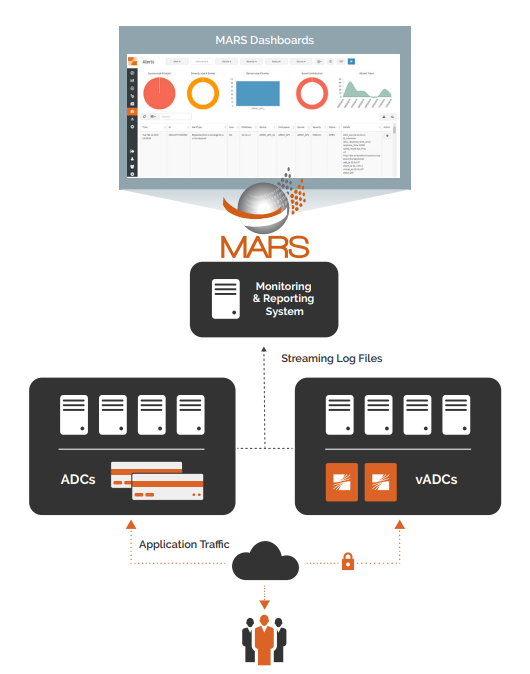
MARS (Monitoring and Reporting System) provides highly granular in-depth monitoring and reporting for one or more physical or virtual Array Networks application delivery controllers (ADCs), providing real-time visibility into traffic patterns, potential server availability or responsiveness issues, SSL handshakes and authorization errors, and much more. Available as a virtual appliance for VMware environments or for Array’s AVX Series Network Functions Platform, MARS provides a centralized console with graphical snapshots of client and server behaviors as well as traffic management statistics. Historical views by minutes, hours, days, months or years are available for all reporting metrics. With MARS, network administrators have a powerful tool to quickly spot trends and trouble spots, ensuring efficient operation and a premium user experience.

Highlights & Benefits
- Graphical and intuitive dashboards offer an at-aglance view of monitored devices, services, tasks and alerts
- Versatile data displays include pie charts, bar graphs, metrics, heat maps, line graphs and other representations
- Includes five standard dashboards (customizable in Advanced version only)
SSL Traffic Dashboard – displays SSL/TLS versions and cipher suites observed in the traffic processed by the Array APV, provides insights into details of the SSL/TLS traffic and allows the administrator to configure/tune settings to suit the security posture appropriate for the organization
HTTP Response Codes Dashboard – Allows easy visualization of server performance and optimization, and shows server error codes for quick diagnosis and remediation of anomalies
Server Delay Dashboard – Shows server response times and delays to quickly spot bottlenecks that decrease performance and impact the user experience
Cache Results Dashboard – Displays cache responsiveness, uncached URLs that consume excessive server resources, top client IPs, real IPs, top requests and URL per real IP, and bytes per URL per real IP
Alerts Dashboard – Includes visual representations of priorities, trends, problem IP addresses and other performance issues; alerts can be prioritized based upon severity and impact
- Resize, arrange and move visualizations to drill down to the most-relevant information (Advanced only)
- Search and filter data, and save searches for later use (Advanced version only)
- Export formatted or raw data from any dashboard for further analysis (Advanced only)
- Supports multiple users and workspaces for rolebased access
- Basic version monitors and reports on up to eight Array ADC appliances (no ability to modify standard dashboards or run/modify reports)
- Advanced version monitors up to 32 Array ADC appliances with full control over modifications to dashboards, running reports and exporting data
- Runs as a VA in VMware environments (Basic or Advanced version) or on AVX Series Network Functions Platform (Basic version only)
Features:
In-Depth Monitoring & Reporting
Working with Array’s physical and virtual ADC appliances, MARS provides highly granular, real-time visibility and reporting for traffic, server performance and cache responsiveness, errors, and many other datapoints to allow fast visualization and remediation of application delivery bottlenecks and other anomalies.
MARS is available in two versions. The Basic version can monitor up to eight Array ADCs, and includes standard dashboards for SSL traffic, response codes, server delays, cache results and alerts. The MARS Advanced version can monitor up to 32 Array ADCs, includes all five standard dashboards and offers the ability to modify dashboard views as desired, and run and modify reports as well. The Advanced version also includes the ability to search and filter data, and to save searches for later use.
Both versions support multiple users and workspaces, and include the ability to set up role-based access to support the needs of different work groups.
Intuitive Dashboards
MARS includes five standard dashboards with graphical representations of important performance metrics and trends. The advanced data display design includes pie charts, bar graphs, heat maps, line graphs and other representations that allow administrators to rapidly visualize, filter data and address problem areas. The dashboards allow drilling down into one or more individual IP address. Each dashboard also offers formatted data that is searchable in the Advanced version, and permits export of formatted or raw data for external analysis and storage.
SSL Traffic Dashboard
The SSL traffic dashboard provides a high-level overview of SSL successes, failures and SSL/TLS versions as well as cipher suites. Using this dashboard, administrators can quickly identify client IPs that are using unsecure SSL versions or cipher suites, and diagnose causes for failed handshakes that can impact employee productivity. In addition, detailed SSL/TLS traffic information allows administrators to configure and tune settings to comply with the organization’s security posture.
HTTP Response Codes Dashboard
The health and performance of web and application servers is a critical component of employee productivity and user experience. MARS’ HTTP response codes dashboard provides a bird’s-eye view of code distribution as well as trends over time to quickly pinpoint and remediate problem sites and servers. Filtering of the codes allows analysis of virtual IPs and URLs that are contributing to a given failure, and drilldown into an individual virtual IP helps identify URLs that are at the root of the issue. In addition, incorrect links can be easily spotted if, for example, failures for a URL begin trending up.
Server Delay Dashboard
Like failed server response codes, server response times can heavily impact user experience and productivity. Thus, monitoring the time to first byte of response from the time a request is dispatched to a real server is important in identifying problem servers as soon as possible. The MARS server delay dashboard allows administrators to drill deep into both the virtual IP and the real IP that are associated with a given response time delay, and thereby locate the individual server quickly so that it can be remediated.
Cache Results Dashboard
Array’s ADCs offer the ability to cache frequently requested data in appliance memory, which can speed response times and reduce bandwidth requirements. If caching is enabled on one or more Array ADCs, the MARS cache results dashboards provides tools to evaluate application usage and cache responsiveness, and to identify URLs that are candidates for caching due to high data transfer volumes. Using this dashboard, administrators can optimize business strategies through understanding which services are resonating with users or customers.
The cache results dashboard includes an overall view of cache performance as well as convenient ‘Top 10’ views of the most active URLs and client IPs. In addition, real IPs can be analyzed by number of requests and data transfer (in bytes) in order to visualize loading per URL on a given real IP. This section includes the ability to drill down to a specific real server for traffic analysis. The dashboard also includes a trends section that allows administrators to identify unusual traffic spikes at a glance.
Alerts Dashboard
The alerts dashboard allows prompt action by administrators when thresholds are exceeded, and allows easy visualization of critical performance parameters.
Specifications:
Supported Hypervisors (64-bit only)
Runs on Array’s Network Functions Platforms or VMware ESXi 4.1 or Later
Virtual Machine Requirements
Requires Minimum:
- 4 Virtual CPUs
- 1 Virtual Network Adapter
- 4GB RAM
- 64GB Disk


